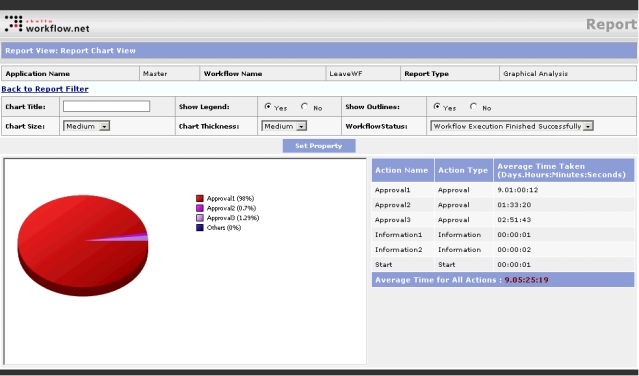
The Report View: Report Chart View screen is displayed when you select the Graphical Analysis option in the Report Type drop down and click on Proceed>>. This screen displays a report with a pie-chart of the workflow analysis results. The header fields at the top shows general information like Application Name, Workflow Name and Report Type. These fields show values that are set in the Report control properties.
Graphical Analysis Report Screen
The Analyze Workflows Graphical Analysis screen has the pie-chart at the lower left with a table showing the corresponding details to its right. The table has three columns – Action Name, Action Type, and Average Time Taken (Days.Hours:Minutes:Seconds). The Average Time for All Actions field located below the table shows the average time taken for all action in the specified duration.
The screen has the following fields and drop downs to set the property of the chart.
The Set Property button is located below the property setting fields. After specifying the different property values you must click this button to set them. The Back to Report Filter link closes the Graphical Analysis Report screen and returns to the Report Filter screen.