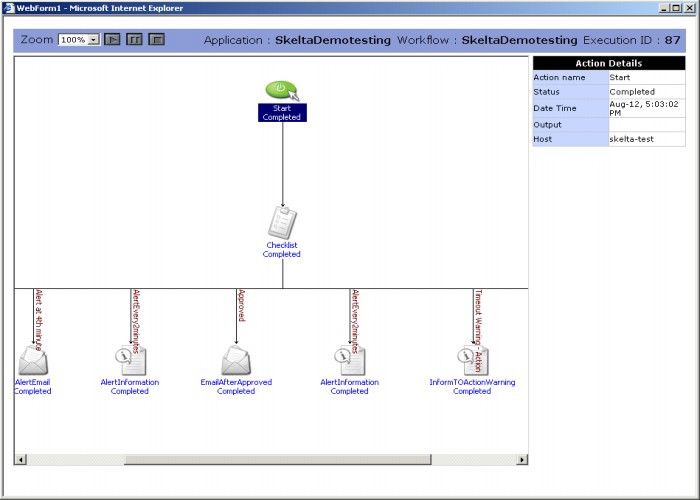
The Graphical View of Workflow Execution can be accessed from both the Detailed Report screen and the Analyze Workflows screen. In both report tables the last column is Graphical View, which has the View link. Clicking this link displays the Graphical View in a new browser window. The Graphical View screen, as shown below, has a graphical representation of the workflow execution. It uses the same icons as used in the Process Designer to represent the actions. The flow of work and the status of different actions are shown.
Graphical View Screen
The Graphical View screen has a toolbar with workflow control buttons as well as general header information like Application, Workflow, and Execution ID. The Graphical View screen also has the Action Details pane located to the right of the graphical view pane. It shows the details corresponding to the action selected on the graphical view pane. The Action Details pane displays action details in the following fields – Status, Date Time, Output and Host. You can click on any action and see its status, date and time at which the status is reported, output and the host. In the image shown below, the action details are shown for the Approval1 action.
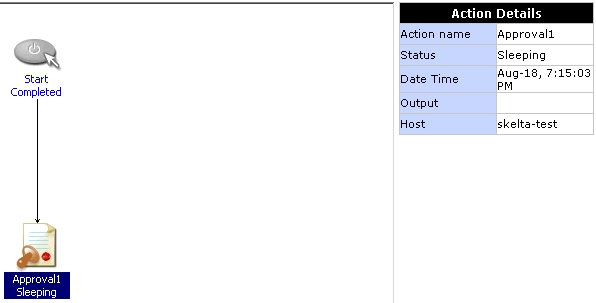
Action Details
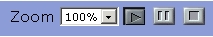
Zoom
The Zoom control is used to change the display size of the graphical workflow display. The dropdown has a list of size options given as a percentage of actual size. You can select any option to reduce or enlarge the display size.
Workflow Control Buttons
The execution of the workflow can be controlled from the Graphical View window. Three buttons have been provided to control workflows. These are located in the toolbar at the top of the Graphical View window.