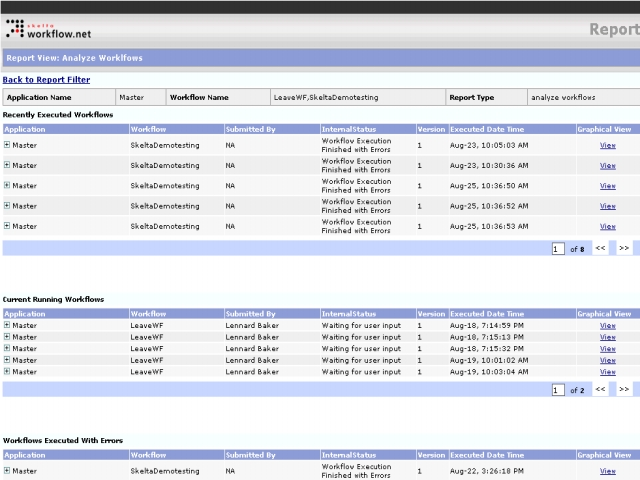
The Report View: Analyze Workflows screen is displayed when you select the Analyze Workflows option in the Report Type drop down and click on Proceed>>. This screen displays a report with three parts based on workflow analysis. The header fields at the top shows general information like Application Name, Workflow Name and Report Type. These fields show values that are set in the Report control properties.
Analyze Workflows Screen
The Analyze Workflows screen has three tables ñ Recently
Executed Workflows, Current Running Workflows, and Workflows
Executed With Errors. The three tables have the following columns - Application,
Workflow, Submitted By, InternalStatus, Version, Executed
Date Time, and Graphical View. The Graphical View column
has the View link which opens the Graphical View
of Workflow Execution screen. Each table has up to three levels, with
the first level having the columns mentioned earlier, displayed by default. The
next levels can be viewed by clicking on the expand icon- ![]() ,
which can be found before each row in the report with a sublevel. When the next
level is expanded the icon changes to the collapse icon-
,
which can be found before each row in the report with a sublevel. When the next
level is expanded the icon changes to the collapse icon- ![]() .
Clicking this will close the sublevel.
.
Clicking this will close the sublevel.
Each table in the Analyze Workflows Report has the << (to move backward) and >> (to move forward) buttons to move between the pages of a multipage report. The Back to Report Filter link closes the Analyze Workflows Report screen and returns to the Report Filter screen.